
Week 1
Toolbox Shakedown
What I asked
How does the Marvel Wikipedia link network split by in-degree versus out-degree? Who gets linked to the most, who links out the most — and are they even the same characters?
What I did
I loaded the week-1 snapshot: 303 characters and 1784 directed links. Collapsing that to an undirected network gives 1434 pairs and an average degree of about 9.5, which matches the course page's numbers. From there I computed each character's in-degree and out-degree, and plotted both as P(k) against k+1 on linear and log-log axes. To keep the noisy tail readable, I used bins that start at width 1 and double in size further out.
What surprised me
In-degree vs out-degree
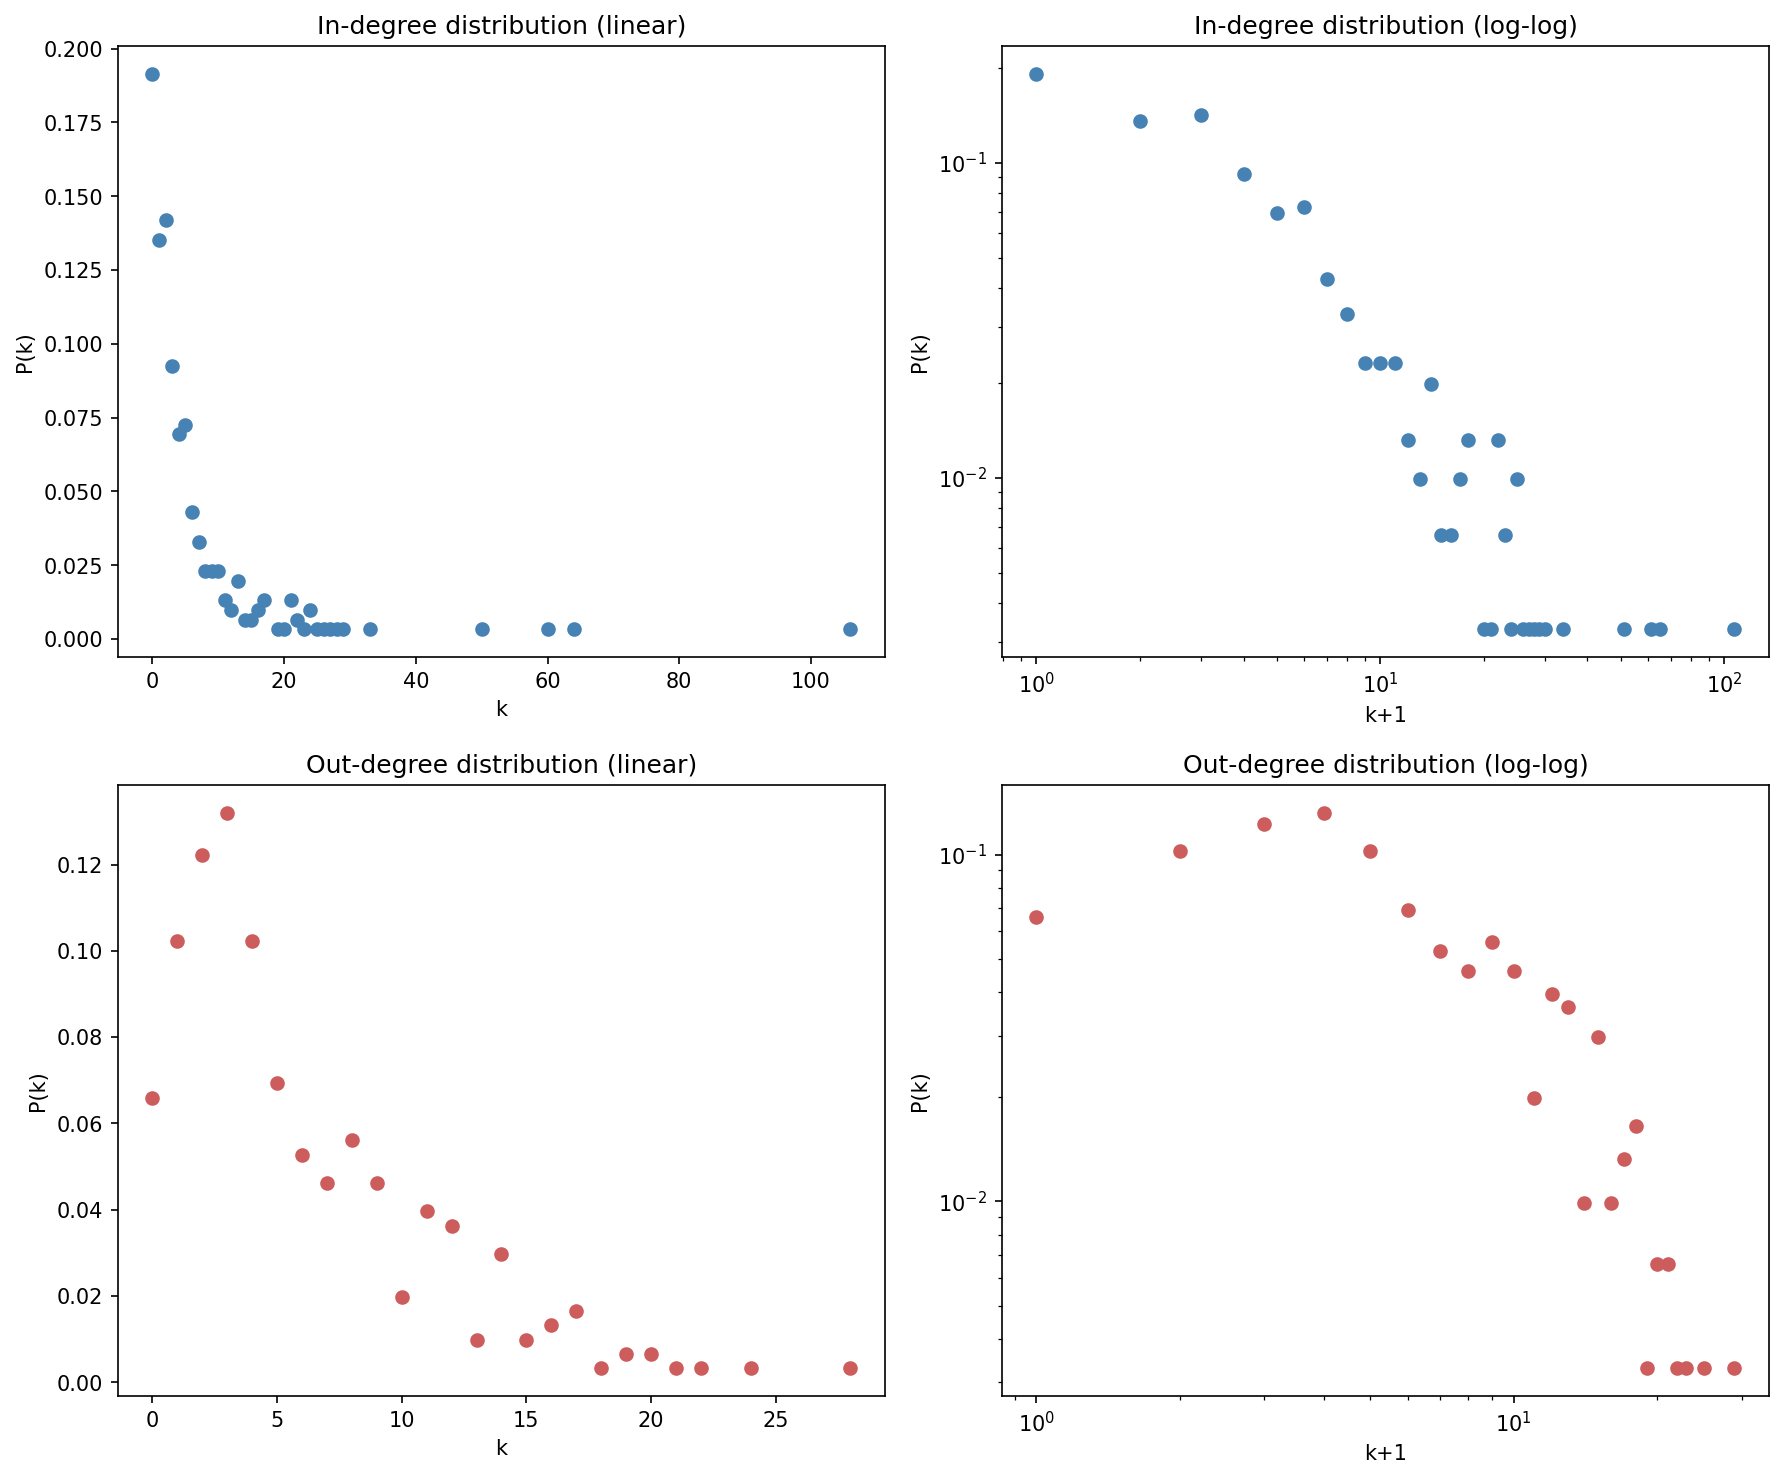
In-degree and out-degree turned out to tell very different stories. Spider-Man has an in-degree of 106 — about a third of the network links to him — but even the character with the most outgoing links, Betsy Braddock, only reaches 28. That makes sense once you think about where the links come from: other editors decide who links to you, but you decide who you link out to. That naturally caps out-degree in a way in-degree never is.
Power law or not?
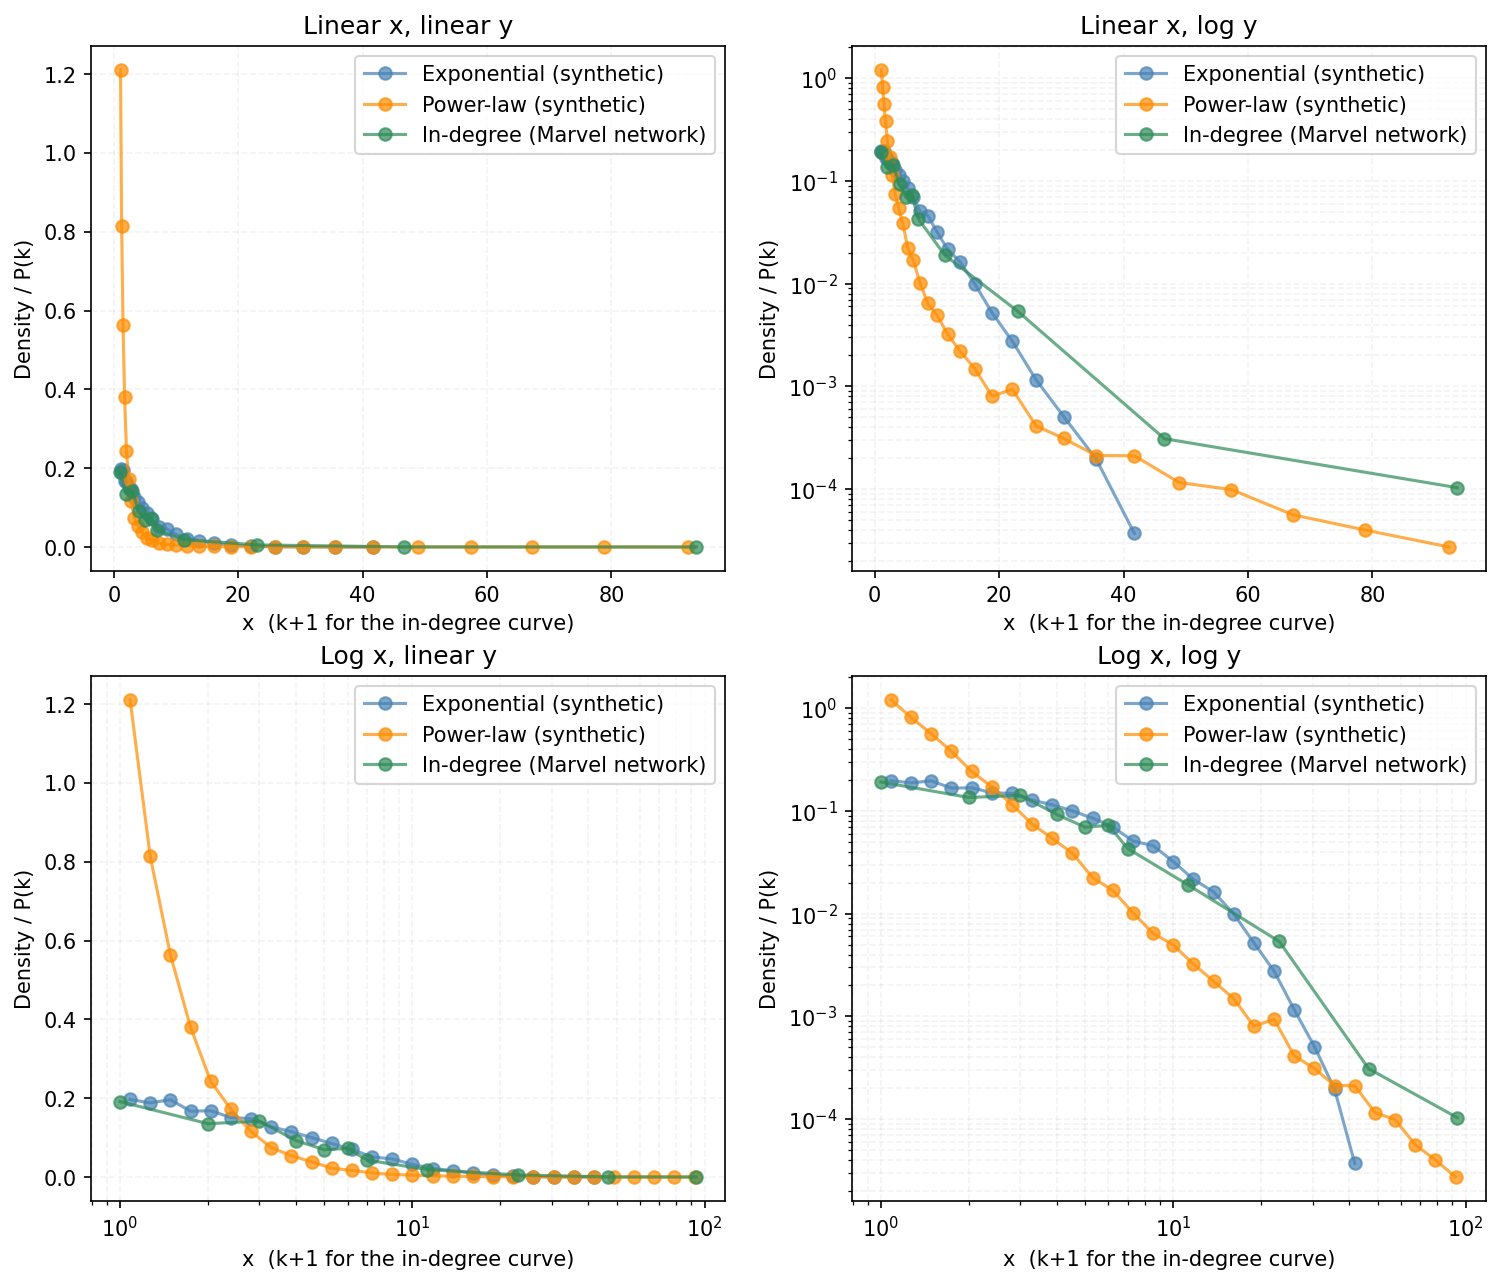
I also compared the real in-degree distribution to synthetic exponential and power-law samples, and I don't see a clear pattern that it resembles either one cleanly. On the log-log plot, it might resemble the power law in the tail, but not clearly. On the linear-log plot, it looks more like the exponential for the lower values - but I'm not confident calling it exponential either.
From the earlier reading, a power law and a lognormal can fit almost the same curve, so "looks straight on log-log" isn't proof by itself.
Week 2
Not posted yet.
Week 3
Not posted yet.
Week 4
Not posted yet.
Week 5
Not posted yet.
Week 6
Not posted yet.
Week 7
Not posted yet.
Week 8
Not posted yet.
Group Name
Maria Poulsen
This group consists of Maria Poulsen.